
4- Do you use mix variances? Meet the Variance Family here

Variance Analysis
Let’s walk through the hierarchy of variances and what they can tell us. There is a sample table at the end. Something like this can be kept current and do a lot of explaining when questions come.
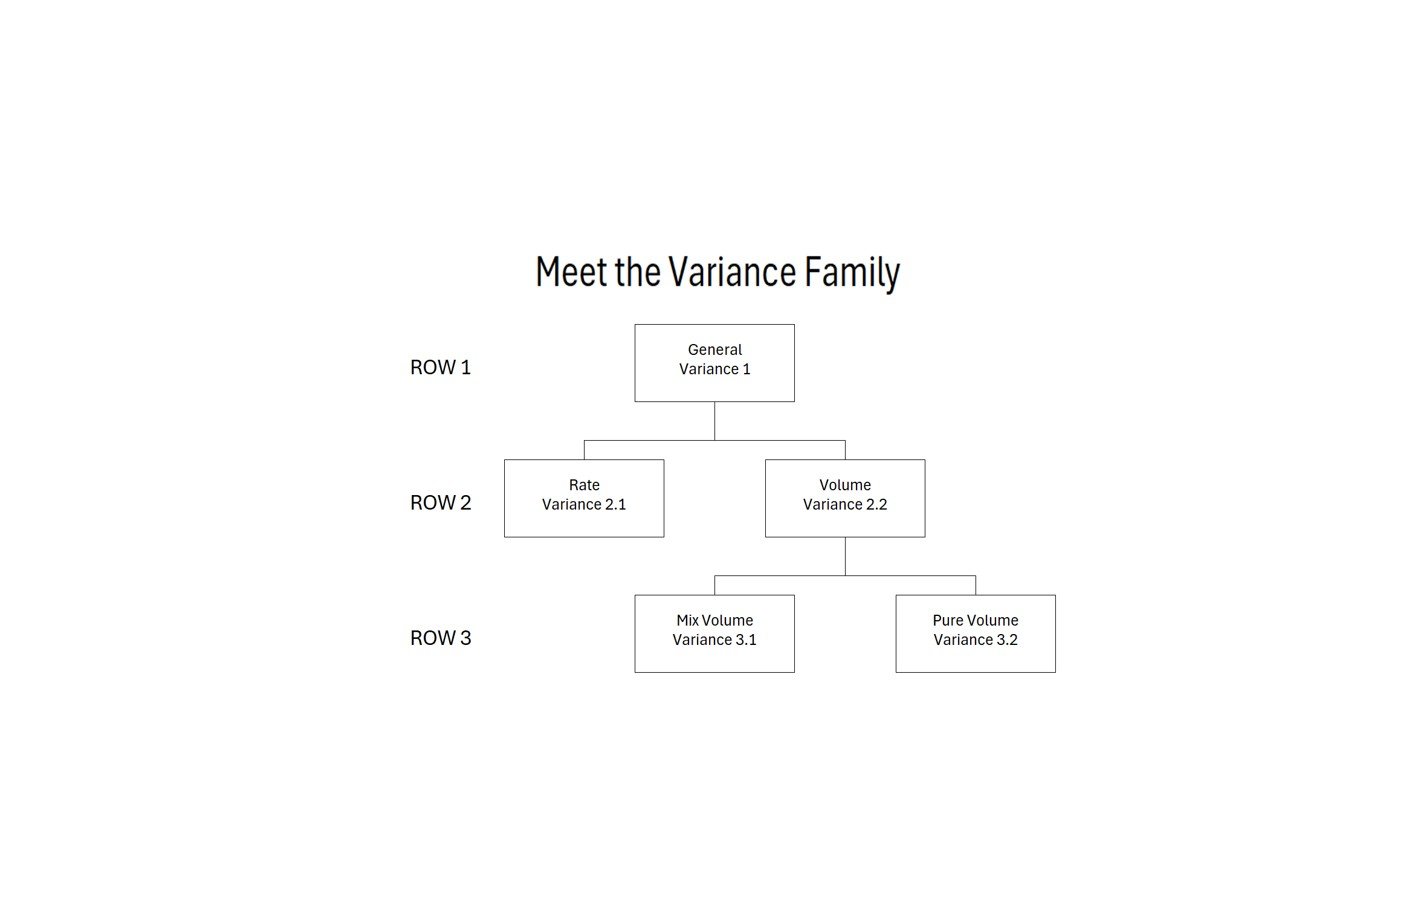
With result management as a specialty, we want to promote the usefulness of any and all tools that hold promise and are practical. So we don’t want to overlook possibly the oldest and most effective tool of all, the variance analysis. Or to be more precise, the Variance Family - for there are layers of them that all serve a purpose. See the family tree on the right.
In this post we want to:
Introduce or review Row 1, the most familiar, and Row 2, seen often but not as much
Put in a plug for the Row 3 Mix Variance that could greatly expand your ability to see performance
Discuss laying the foundation for distribution and training that can increase usage
Set the stage for Part 2 of this post: using variance analysis in unconventional ways to suggest strategic moves
Row 1 and Row 2 Variances
Let’s start with the most familiar form of variance, the General Variance. You have seen it a thousand times in all liklihood. It will always have three columns that allow the reader to compa the first to the second by way of a difference calculation in the third. Attached are simple example of a General Variance for Margin.
You have see sales reports, wage reports, entire trial balances, and more this way. It is worthy of mention because it is a control tool for all other forms of variance reports. In other words, as you start using Row 2 and Row 3 measurements, you are digging into a food chain that must tie back the the General Variance figures. So let’s do that digging:

Row 2 Variance is the classic Rate versus Volume. It can be used for any situation that has quantities and per unit costs. In this example we are going to take the example just show with a variance of 18,960 unfavorable (margin actual less than margin budget) and break it out to learn more.
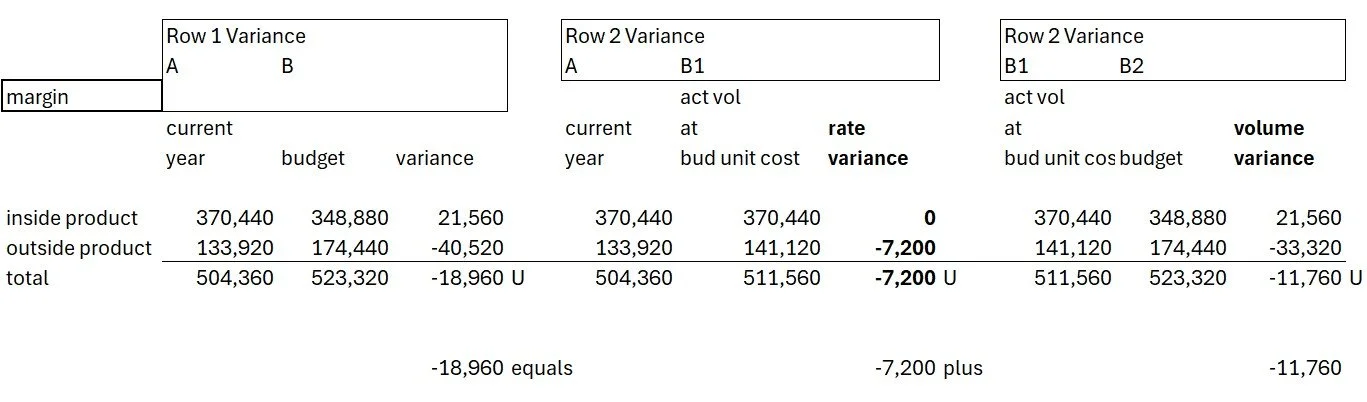
The total margin variance was due 7,200 to rate (the margin per unit was lower than budget) and 11,760 was due to volume (more units sold that budget. You can see other things, like Inside actually having a favorable volume variance while Outside was unfavorable by more than inside was favorable.
Then comes the Row 3 Variance - the so-called Mix Variance. The importance of this comes when certain performance is hidden from a Row 2 calculation.

Here is where the cascading sets of variances ends up. The Mix Variance of 17,640 means that this part of the variance is not caused by a unit cost overage or a volume shortage - but by a difference in the split in products.

Here is the full calculation table. This can be set up in background for any sales analysis or other comparison and pulled from when useful variances are flagged.
